How to size Java memory in Kubernetes (MaxRAMPercentage and OOMKill)
This post came out of a real problem. A fleet of Java applications running on
Kubernetes had standardized JVMs on
-XX:InitialRAMPercentage=75 -XX:MaxRAMPercentage=75 and sized memory requests
and limits by looking at container.memory.usage and working_set in
observability. On paper it looked right: the JVM takes 75% of the limit, 25% is
left for everything else, and you track RSS to tune.
In practice, two symptoms showed up:
- RSS for every application sat pinned at ~75% of the limit — including
devenvironments that barely saw traffic. There was no way to tell who was actually wasting memory. - When we tried to cut limits based on that RSS, several applications started getting OOMKilled (exit 137).
This is one of those cases where the metric you’re looking at is lying — not
because it’s wrong, but because you’re interpreting it wrong. I’ll document what
I found investigating data from real environments and, at the end, I built a
reproducible PoC (Docker + Java 21) that proves every claim with measured
numbers. All PoC code lives in the public repo
LucasBG0/poc-jvm-memory-containers
and runs with ./run.sh.
The “production” numbers throughout the text come from a real Java app fleet on K8s, anonymized. The “PoC” numbers were measured on my machine and you can reproduce them.
The basics everyone gets wrong
Before anything else, you need to separate four flags that look like they do the same thing and don’t.
-Xms and -Xmx (absolute)
These are the initial (-Xms) and maximum (-Xmx) heap sizes, in
absolute values (-Xmx512m). The classic container problem: for a long time,
the JVM did not see the cgroup and calculated these values from the host’s
full RAM. You set a 512 MiB pod limit and the JVM thought it had 64 GiB to
play with → OOMKill on the first load. That was fixed (JDK 8u191+ and 10+ are
container-aware), but fixed -Xms/-Xmx is still manually coupled: if
someone changes the container limit and forgets to change -Xmx, the two drift
apart.
-XX:MaxRAMPercentage (the ceiling, cgroup-aware)
Sets the maximum heap as a percentage of available memory (which, in a
container, is the cgroup limit). This is the modern, recommended approach: you
change the pod limit and the heap follows. MaxRAMPercentage=75 in a 768 MiB
container → 576 MiB max heap.
-XX:InitialRAMPercentage (the initial size, cgroup-aware)
Same idea, but for the initial heap size (the percentage equivalent of
-Xms). This is where much of the confusion in this post lives: setting a high
InitialRAMPercentage does not mean your app needs that much — it means the JVM
will commit that much at boot.
-XX:MinRAMPercentage (the gotcha)
This is the JDK’s most misleading name. MinRAMPercentage does not define
a heap floor, despite the name. It only kicks in when available memory is
small (below ~256 MiB by default) and, in that case, sets the max heap to
that percentage. For any container with “normal” memory, MinRAMPercentage is
simply ignored and MaxRAMPercentage wins. I’ll prove that with the PoC
later.
The PoC: what it measures
The PoC is a single Java program (MemReport.java) running in Java 21 “source
mode”, inside an eclipse-temurin:21-jdk image, with a fixed container limit
via docker run --memory. It:
- retains a controlled live set (30 MiB of
byte[]that survive GC) — representing the memory the app actually needs; - generates churn (short-lived garbage) to fill eden;
- takes two snapshots: BOOT (right after startup, before allocating) and POST (after retaining the live set + churn);
- forces a
System.gc()at the end and measures the post-GC live set (old + survivor); - reads
/sys/fs/cgroup/memory.currentandmemory.maxfrom inside the container to report real RSS and limit.
I ran seven scenarios, all with the same 30 MiB live set, varying only the flags. Here is the full table (values in MiB):
| scenario | limit | heap max (Xmx) | committed BOOT | RSS BOOT | committed POST | RSS POST | heap used POST | non-heap committed | threads | live set (post-GC) |
|---|---|---|---|---|---|---|---|---|---|---|
default | 768 | 192 | 27 | 85 | 192 | 175 | 82 | 21 | 6 | 64 |
init-max-75 | 768 | 576 | 576 | 104 | 576 | 239 | 212 | 21 | 6 | 64 |
init-max-75-pretouch | 768 | 576 | 576 | 645 | 576 | 654 | 212 | 21 | 6 | 64 |
low-init-max-75 | 768 | 576 | 118 | 108 | 576 | 392 | 187 | 21 | 6 | 64 |
xmx-xms | 768 | 512 | 512 | 114 | 512 | 231 | 160 | 21 | 6 | 64 |
minram-small | 200 | 100 | 25 | 67 | 100 | 122 | 70 | 21 | 6 | 64 |
minram-large | 768 | 576 | 21 | 92 | 576 | 379 | 188 | 21 | 6 | 64 |
oom-xmx-acima-do-limit | 600 | — | — | — | — | exit 137 | — | — | — | — |
I’ll unpack each lesson using this table.
Pitfall #1: InitialRAMPercentage commits, but that’s not “usage”
Look at the committed BOOT column (heap committed at boot, before any allocation):
default(default Initial ~1.5%): 27 MiBlow-init-max-75(Initial=15%): 118 MiBinit-max-75(Initial=75%): 576 MiBxmx-xms(-Xms512m): 512 MiB
In other words: InitialRAMPercentage/-Xms controls how much heap the JVM
reserves and commits at startup, regardless of what the app needs. With
Initial=75, the JVM commits 576 MiB of heap before the app does anything
useful.
But — and this “but” is the heart of the problem — committing is not touching.
Look at the RSS BOOT column: even after committing 576 MiB of heap,
init-max-75 boots with RSS of only 104 MiB, practically the same as
default (85 MiB). The kernel only counts in RSS the pages that were actually
accessed (page fault). Committed but untouched heap is reserved address space,
not physical memory.
Here is the boot snapshot from the init-max-75 scenario, straight from the PoC
log:
### BOOT (before allocating)
  container limit (cgroup) : 768 MiB
  container RSS   (cgroup) : 120 MiB
  heap max (effective Xmx) : 576 MiB
  heap used                : 10 MiB
  heap committed           : 576 MiB   <-- committed 75% of limit
So why did production RSS stay pinned at 75%?
Two reasons, and the PoC shows both.
(a) AlwaysPreTouch. If the JVM starts with -XX:+AlwaysPreTouch (common in
setups that pin the heap for predictable latency), it touches every committed
page at boot. See the init-max-75-pretouch scenario: RSS BOOT jumps from 104
to 645 MiB. Now RSS reflects committed, not demand.
(b) Fixed heap + real load. With Initial = Max, the heap never shrinks, and
as the app runs (allocation, GC evacuation), pages get touched until RSS hits
committed and stays there. In production, with continuous traffic for days, that’s
exactly what happens: RSS saturates at ~75% and stays.
The outcome is the same either way: working_set/container.memory.usage stop
reflecting real demand and start marking ~75% of the limit for everyone. That’s
why dev, with no load, showed the same RSS as production. Sizing request from
that number means sizing from your own MaxRAMPercentage, not from what the app
needs.
Pitfall #2: “real usage” is the post-GC live set, and it’s invariant
If RSS lies, what number doesn’t? The live set: what remains on the heap after a GC — the objects the app actually holds.
The JVM splits the heap into generations. The identity is exact:
heap_used = eden + survivor + old- eden: where new objects are born. It’s churn — short-lived garbage the GC sweeps. It grows and shrinks with available heap.
- survivor + old: what survived GC. That’s the live set — memory the app actually retains.
The proof is in the PoC. In all seven scenarios that ran to completion, the post-GC live set was exactly 64 MiB (last column), because it’s always the same app retaining the same blocks. (I retained 30 arrays of 1 MiB, but each one spills into a G1 region and rounds to two → ~60 MiB of humongous objects + retained classes ≈ 64 MiB; the detail doesn’t matter, what matters is that it’s constant.) Heap configuration doesn’t change what the app needs — only how much empty space surrounds it.
Now look at the perverse side effect in the heap used POST column (peak heap used during churn):
default(192 MiB heap): peak of 82 MiBinit-max-75(576 MiB heap): peak of 212 MiB
Same app, same 64 MiB live set, but the heap_used peak is 2.5× larger just
because the heap is bigger. Why? Bigger heap → GC runs less often → more
floating garbage (eden + dead objects not yet collected) accumulates between
collections. That’s another reason looking at the peak of heap_used (or
RSS, which follows touched heap) overestimates real need. The honest number is
the post-GC trough: old + survivor.
The metrics that survive the distortion are:
jvm.gc.old_gen_size+jvm.gc.survivor_size→ live set (retained heap);jvm.non_heap_memory(Metaspace, Code Cache, Compressed Class) → off-heap, grows on demand;jvm.buffer_pool.direct.used(DirectByteBuffer) andjvm.thread_count(≈ 1 MiB per thread stack) → native memory, off-heap, but counted in RSS.
And the ones you should stop using for sizing while Initial is high:
container.memory.usage, working_set, and jvm.heap_memory_committed — all
inflated.
Pitfall #3: the one that hurts — OOMKill 137
This is the part that cost us. With “real usage” in hand, the first attempt was the intuitive formula:
request = limit = real_live_usage × 1.2Take old + survivor + non_heap_used + direct + threads, multiply by 1.2 for
headroom, and cut the limit. Looked great on the dashboard: ~50% savings.
Result in dev/qa: a wave of applications getting OOMKilled (exit 137).
The root cause had two parts, both ignored by the naive formula:
non_heap_committed, notnon_heap_used. Metaspace and Code Cache reserve (commit) blocks slightly above what they use and almost never give them back. It’scommittedthat counts in RSS and triggers OOM, notused. The gap between the two is small, but it’s worth usingnon_heap_committedout of conservatism.- Invisible native overhead. GC and JIT internal structures, page cache, and
especially APM/monitoring agents (Datadog Agent, New Relic, AppDynamics,
Elastic APM…) — none of this shows up in
jvm.*metrics, but all of it occupies RSS. Reconciling against real RSS in that fleet, this native residue was 66–254 MiB (average ~130 MiB). The 150 MiB constant was the value that worked for that set of services; the right number for your fleet depends on what runs inside the container. How to calibrate is described in the formula section below.
Add the two together and you can see why limits cut with the “live × 1.2” formula landed below the JVM’s physical floor and died.
The PoC reproduces exit 137 deterministically in the oom-xmx-acima-do-limit
scenario: a 600 MiB container with -Xms700m -Xmx700m -XX:+AlwaysPreTouch. The
configured heap (700 MiB) doesn’t fit in the container (600 MiB), and
AlwaysPreTouch tries to touch everything at boot:
>> scenario: oom-xmx-acima-do-limit  (--memory=600m)  flags: -Xms700m -Xmx700m -XX:+AlwaysPreTouch
   [!] container exited with code 137 (137 = OOMKill)
Same mechanism, more explicit: when heap_max + non_heap_committed + native
exceeds limit, the kernel kills the process. In production it happened quietly
because nobody was adding non-heap and native to the math.
The formula that survived
After the 137s, the sizing formula became this (request = limit policy, i.e.
Guaranteed QoS — the JVM tends to grow to the ceiling, so request < limit
doesn’t help):
limit = live_heap_pico / occ
      + non_heap_committed
      + direct.used
      + thread_count × 1 MiB
      + N MiB   (native residue: calibrated per fleet — see below)
The terms, mapped to metrics that survive the distortion:
| term | metric | role |
|---|---|---|
live_heap_pico | max(old_gen_size + survivor_size) | heap the app retains |
occ | — | target heap occupancy (live as fraction of heap) |
non_heap_committed | max(non_heap_memory_committed) | Metaspace + Code Cache (reserved) |
direct.used | max(buffer_pool.direct.used) | DirectByteBuffer (native) |
thread_count × 1 MiB | max(thread_count) | thread stacks (native) |
N MiB | calibrated constant | native overhead with no direct metric |
How to calibrate native residue (N)
N has no dedicated JVM metric because it lives outside managed heap and
non-heap. In practice, it’s the gap between measured RSS and everything you can
sum directly:
N ≈ RSS_stable − heap_committed − non_heap_committed − direct.used − (threads × 1 MiB)Stable RSS is container.memory.usage (or cgroup memory.current) read when
the app is warmed up and under representative load, but without high
InitialRAMPercentage or AlwaysPreTouch — otherwise RSS reflects committed
but untouched heap, and the calculated N is artificially inflated. Use a low
InitialRAMPercentage config (e.g. 25%) for this measurement.
The main components of this residue:
- APM agent (Datadog Agent, New Relic, AppDynamics, Elastic APM…): the Java
agent attaches as a
-javaagentand allocates its own native memory — 30 to 100+ MiB depending on the agent and instrumentation level. - Metrics exporter (Prometheus JMX Exporter, Micrometer…): smaller impact, but not zero.
- Native thread stacks beyond the nominal
1 MiB: each thread’s real stack (default-Xss1mon Linux) plus associated kernel structures. - GC internal overhead: G1GC maintains card tables, remembered sets, and marking bitmaps that scale with heap size (typically 1–5% of max heap).
- Kernel page cache and I/O buffers:
mmap’d files, network buffers — the kernel counts them in process RSS.
In the fleet that originated this post, N = 150 MiB covered most services well
(actual range: 66–254 MiB). If you run a heavy APM agent or have many threads,
measure and adjust; 150 MiB is a starting point, not a universal constant.
The worst case is underestimating: you’ll see OOMKill. The second worst is
overestimating a lot: you waste memory but the app survives.
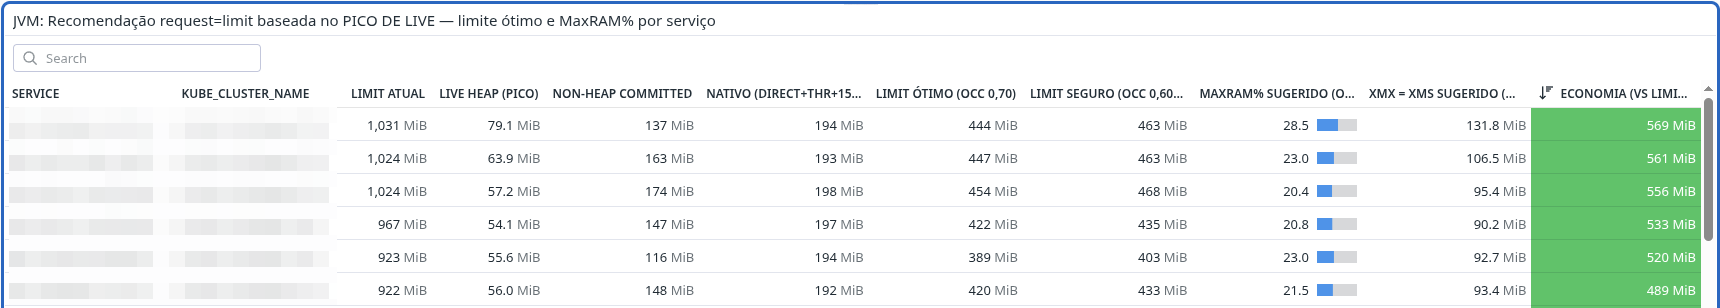
With JVM metrics collected, you can build a dashboard that applies this formula
automatically and shows the recommended request/limit per service:
Why divide by occ?
The heap must be larger than the live set to fit eden allocation between GCs, G1 evacuation working space, and spikes. Rule of thumb: live set shouldn’t exceed ~70% of heap, or GC enters thrashing (chained full GCs → high CPU → OOM from GC overhead limit).
occ = 0.70(aggressive):heap = live × 1.43. Saves more memory, more frequent GC.occ = 0.60(recommended):heap = live × 1.67. More headroom, less GC, a bit more memory.
The central trade-off is memory ↔ CPU/safety. We settled on 0.60 as the
default.
Two equivalent ways to apply it
The target heap (live/occ) is the same; only how you express it changes:
(A) Percentage:
-XX:InitialRAMPercentage=<P> -XX:MaxRAMPercentage=<P>
where P = (live/occ) / limit × 100
The heap follows the limit and never exceeds it — MaxRAMPercentage gives
you that guardrail for free.
(B) Explicit:
-Xms<live/occ> -Xmx<live/occ>Direct, but decoupled from the limit. Requires a guardrail in Helm/CI
ensuring -Xmx + non_heap + native ≤ limit, or you hit the PoC’s exit 137
scenario.
In real microservice apps, that P landed in the 26–45% range — far from the
standardized 75%. That was the waste.
Bonus pitfall: high MaxRAMPercentage embeds OOM risk
There’s a dangerous structural detail. Because MaxRAMPercentage ties heap_max
to the limit, in small apps the JVM’s floor can already exceed the limit:
heap_max (75% of 768) = 576 MiB
+ non_heap_committed   = 227 MiB   (real case)
= 803 MiB  >  limit of 768 MiB
And that’s before counting native overhead. With MaxRAMPercentage=75, a
non-heap-heavy app is born with a theoretical ceiling above the limit. It works
while the heap doesn’t fill — but it’s a time bomb. The immediate mitigation in
production was lowering Initial/Max from 75 → 65 on the tightest apps, then
applying the formula per service.
The MinRAMPercentage gotcha, proven
Back to the misleading name. Compare the two PoC scenarios, both with
-XX:MinRAMPercentage=50 -XX:MaxRAMPercentage=75:
minram-small(200 MiB container): heap max = 100 MiB = 50% of 200 →MinRAMPercentagegoverned.minram-large(768 MiB container): heap max = 576 MiB = 75% of 768 →MinRAMPercentagewas ignored,MaxRAMPercentagegoverned.
The rule: below ~256 MiB of available memory, MinRAMPercentage sets the
ceiling; above that, it does nothing. In practice, for 99% of app containers,
setting MinRAMPercentage has no effect — and it’s a recurring source of
confusion. If you want to control heap, the lever is MaxRAMPercentage.
Actionable best-practices checklist
What we learned, summarized:
- Don’t size JVM memory from
container.memory.usage/working_setif you use highInitialRAMPercentageorAlwaysPreTouch. Those numbers mark ~MaxRAMPercentageof the limit, not demand. - Measure real usage from the post-GC live set:
old_gen_size + survivor_size. Eden is churn, don’t add it. - Don’t forget non-heap and native.
non_heap_committed+ thread stacks + direct buffers + native residue (N). Ignoring them caused the OOMKill 137s.Ndepends on what runs in the container — calibrate by measuringRSS_stable − heap_committed − non_heap_committed − direct − threads×1MiB. 150 MiB worked for that fleet; yours may differ. request = limit(Guaranteed) for JVM — it grows to the ceiling.MaxRAMPercentagevs fixed-Xmx:MaxRAMPercentagefollows the limit and gives you a guardrail. If you use-Xmx, add an explicit guardrail in CI/Helm.MinRAMPercentageis almost never what you want. It only acts in tiny containers (<256 MiB).- Watch high
MaxRAMPercentageon small apps:heap_max + non_heap_committedmay already exceed the limit.
Appendix: running the PoC
Everything is in poc.
Prerequisite: Docker with cgroup v2 — runs on the eclipse-temurin:21-jdk image.
git clone [email protected]:LucasBG0/poc-jvm-memory-containers.git
cd poc
./run.sh
The script builds the image, runs seven scenarios with the same container limit,
and generates results.md (the table in this post) and a logs/<scenario>.log
with two memory snapshots per run. Scenarios cover:
default,init-max-75,init-max-75-pretouch,low-init-max-75— effect ofInitial/Maxon committed, RSS, and heap peak;xmx-xms— explicit form, equivalent to percentage;minram-small/minram-large— theMinRAMPercentagegotcha;oom-xmx-acima-do-limit— deterministic exit 137.
Numbers vary slightly between runs (RSS is instantaneous and oscillates with GC),
but the deterministic signals — heap committed at boot, heap ceiling, RSS with
AlwaysPreTouch, post-GC live set — are stable and tell the whole story.